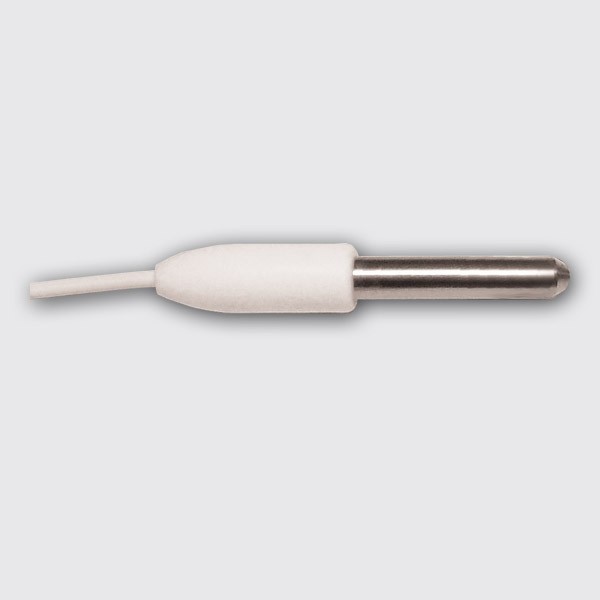
professionals temperature dataloggers

LogTag Analyzer software for Windows provides an easy to use powerful platform for configuring any LogTag recorder product before deployment and for data analysis when the recorder is retrieved.
Características:
Screen captures:
Diagram
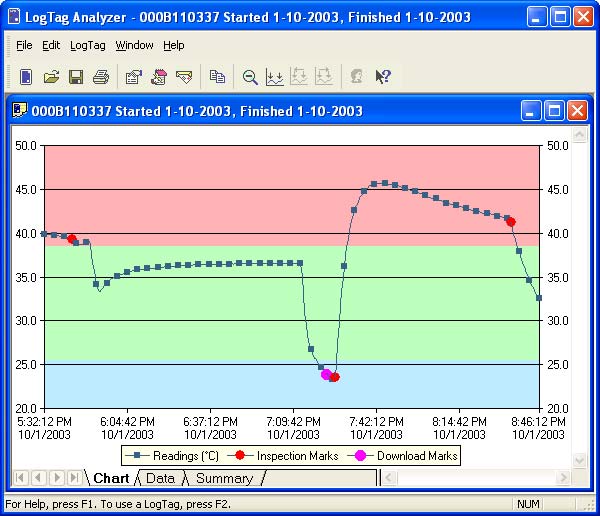
The LogTag Analyzer software shows, in a standard form, the loaded data (either directly from the registrar or from a saved file) in diagram form.
In this case the red surface represents the superior part whilst the blue surface represents the inferior part of the established threshold value. The green surface shows the “OK” state.
Zoom
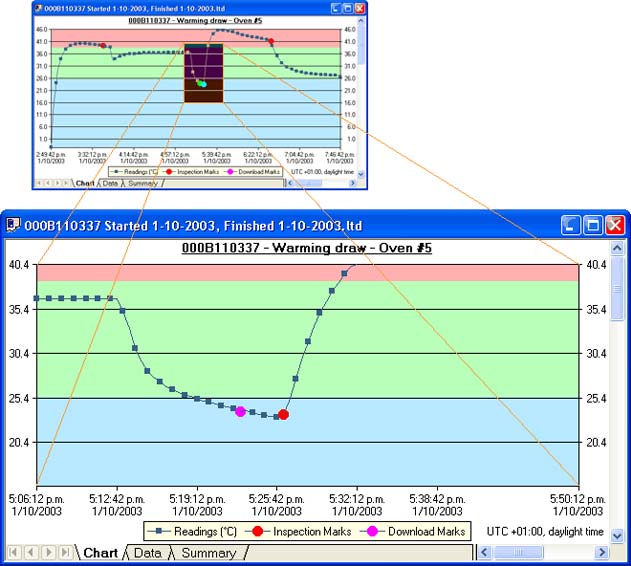
Dragging the mouse we can enlarge any zone of the diagram.
Example of a generated report.
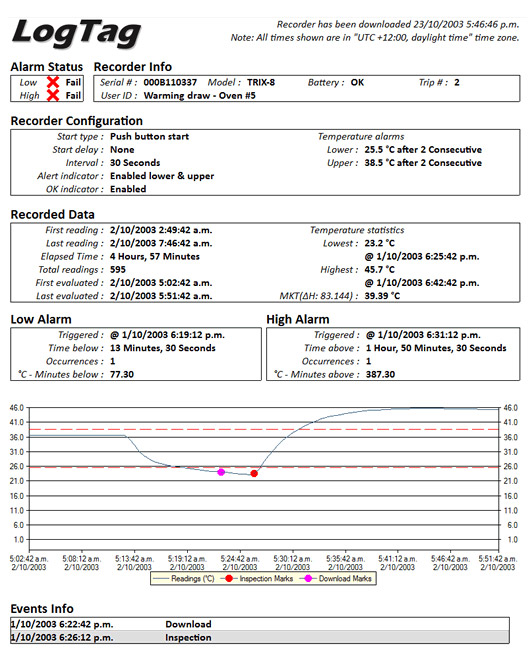
Parameters and transport journey information are grouped into easily recognisable sections.
Configuration of the Software (panel in language of the user)
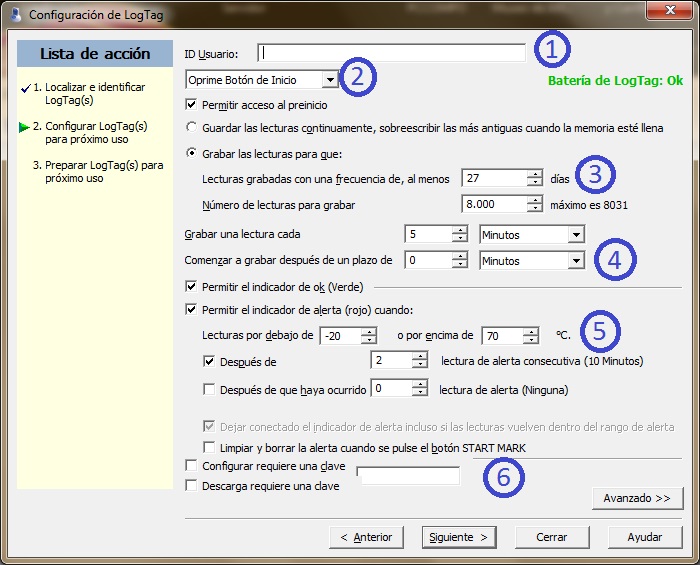
Typical configuration taking a registrar of temperature and humidity HAXO-8 as an example.
1.- The identifier which can be assigned to each thermograph to differenciate between them.
2.- Starting, from the start button or choose a date and time for automatic start up
3.- Days which need reading before the collection of reading data.
4.- The time in paused state that is needed while the equipment is started and is placed in its correct position.
5.- The definition of alarms in the graph when inferior or superior marked temperatures are breached.
6.- The control of readings and configuration using a password.
Insertion of comments
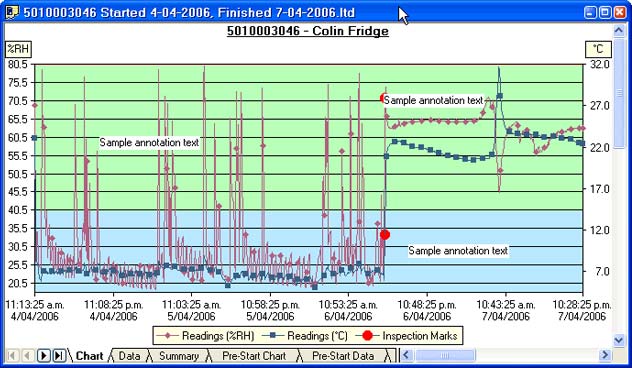
In the diagram we can easily include any comments we wish.
Example of multiple diagram 1
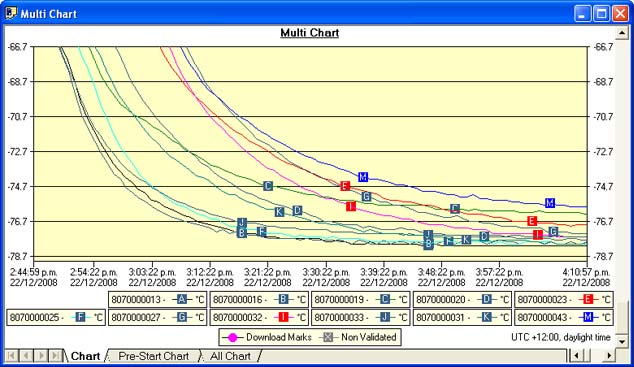
The representation of various lines of measurement in one diagram gives a valuable help to be able to compare the readings among themselves.
Example of multiple diagram 2
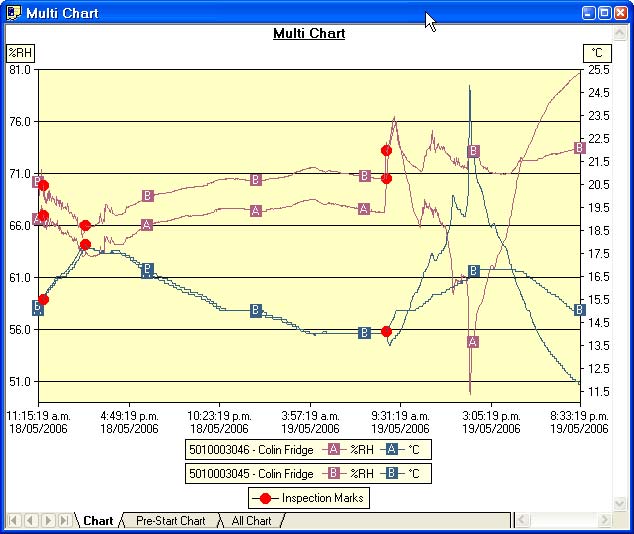
Comparison of two registers of temperature and humidity.
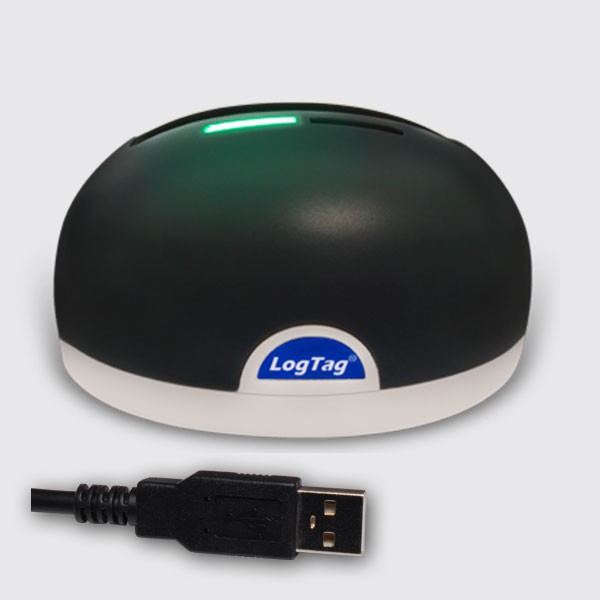
LogTag Analyzer software for Windows provides an easy to use powerful platform for configuring any LogTag recorder product before deployment and for data analysis when the recorder is retrieved.